Comparing ECT Results to Signs of Instability in the Surrounding Slopes—Exploring a large international data set
By Frank Techel, Karl Birkeland, Doug Chabot, Jim Earl, Ivan Moner, and Rob Simenhois
Since its introduction in 2006, the Extended Column Test (ECT) has become one of the most popular tests to assess point snow instability. In 2009, two studies explored how ECT results correlated to observed instabilities, laying the foundation for the tests’ interpretation we are using today. Based on data from the first winters, Ron Simenhois and Karl Birkeland showed that ECTVs and ECTPs were typically observed when conditions indicated instability, while ECTNs and ECTXs were mostly observed on stable slopes (for ECT scoring abbreviations refer to observational guidelines [Greene et al., 2010]). This continues to be the standard for interpreting ECTs in the United States. In Switzerland, Kurt Winkler and Jürg Schweizer noted that ECTP≤21 detected a large proportion of unstable slopes correctly while keeping the number of false alarms low. Again, ECTNs or ECTXs were more frequently associated with stable slopes in their study. In Switzerland, this is the operationally used approach to classify ECT results.
Now, more than ten years later, the ECT test a well-established internationally. The time is right to revisit these stability interpretations, as recently done using Swiss data (Techel et al., 2020), by combining ECTs from North America (mostly from the U.S.), Spain, and Switzerland.
What Data Did We Use?
We explored several snow profile databases from snowpilot.org, Val d’Aran (Spain) and Switzerland. We only included backcountry snowpit profiles with ECT results and information about the presence or absence of clear signs of instability. In total, we had:
- 2,579 ECTs from snowpilot.org, with about 90% from U.S. (snowpilot.org is open to the public)
- 167 ECTs from Val d’Aran / Spain, with profiles mostly collected by forecasters and observers
- 1,226 ECTs from Switzerland, with profiles observed by researchers and field observers
These ECTs are therefore just a small subset of the more than 30,000 combined ECTs in these databases.
How Did We Analyze the Data?
For each ECT, if more than one failure was indicated we used the following rules to decide which result was the most relevant for stability assessment:
- If an ECTV or ECTP failure was recorded: we considered the lowest number of taps required for full propagation.
- If full propagation was not observed, we considered the lowest number of taps associated with the ECTN or ECTX.
If there were several ECT results in the same snow pit, we randomly picked one. This provided us with a dataset of almost 4,000 ECT results.
We classified the stability of each ECT location by relying on observed signs of instability in its surroundings.
We considered ECT locations to be unstable when signs of instability (such as cracking or collapsing) or recent avalanches were observed in surrounding slopes. If observers clearly stated that neither signs of instability nor recent avalanches were present, or if they indicated that the slope in question was skied or snowmobiled (in the U.S.), we considered these locations to be stable. In our dataset 32% of the ECT locations were classified as unstable and 68% as stable. These are our base rates, and we will compare the results of the tests to these base rates.
For those of you interested in a little more information on our analyses, read this paragraph. If you are not interested, feel free to skip to the next section.
For a more scientific and detailed description, we refer you to Techel et al. (2020). In short, for each combination of ECT results (whether or not it propagated and the number of taps), we calculated the proportion of tests associated with observations of instability. To smooth the scatter in our results, we calculated a running mean of the proportion of unstable observations for five consecutive numbers of taps. We then asked: Is the proportion of unstable slopes of a specific ECT result (propagation and number of taps) significantly higher (or lower) than our base rate (0.32)? If the proportion unstable was higher than the base rate, the respective ECT result (propagation and number of taps) was clearly observed more often in unstable locations, confirming this result was more commonly associated with unstable conditions. If the proportion unstable was lower than the base rate (0.32) then those results correlated more often with stable conditions. Values that were not significantly different from the base rate were interpreted as neither truly unstable nor stable.
What Did We Find?
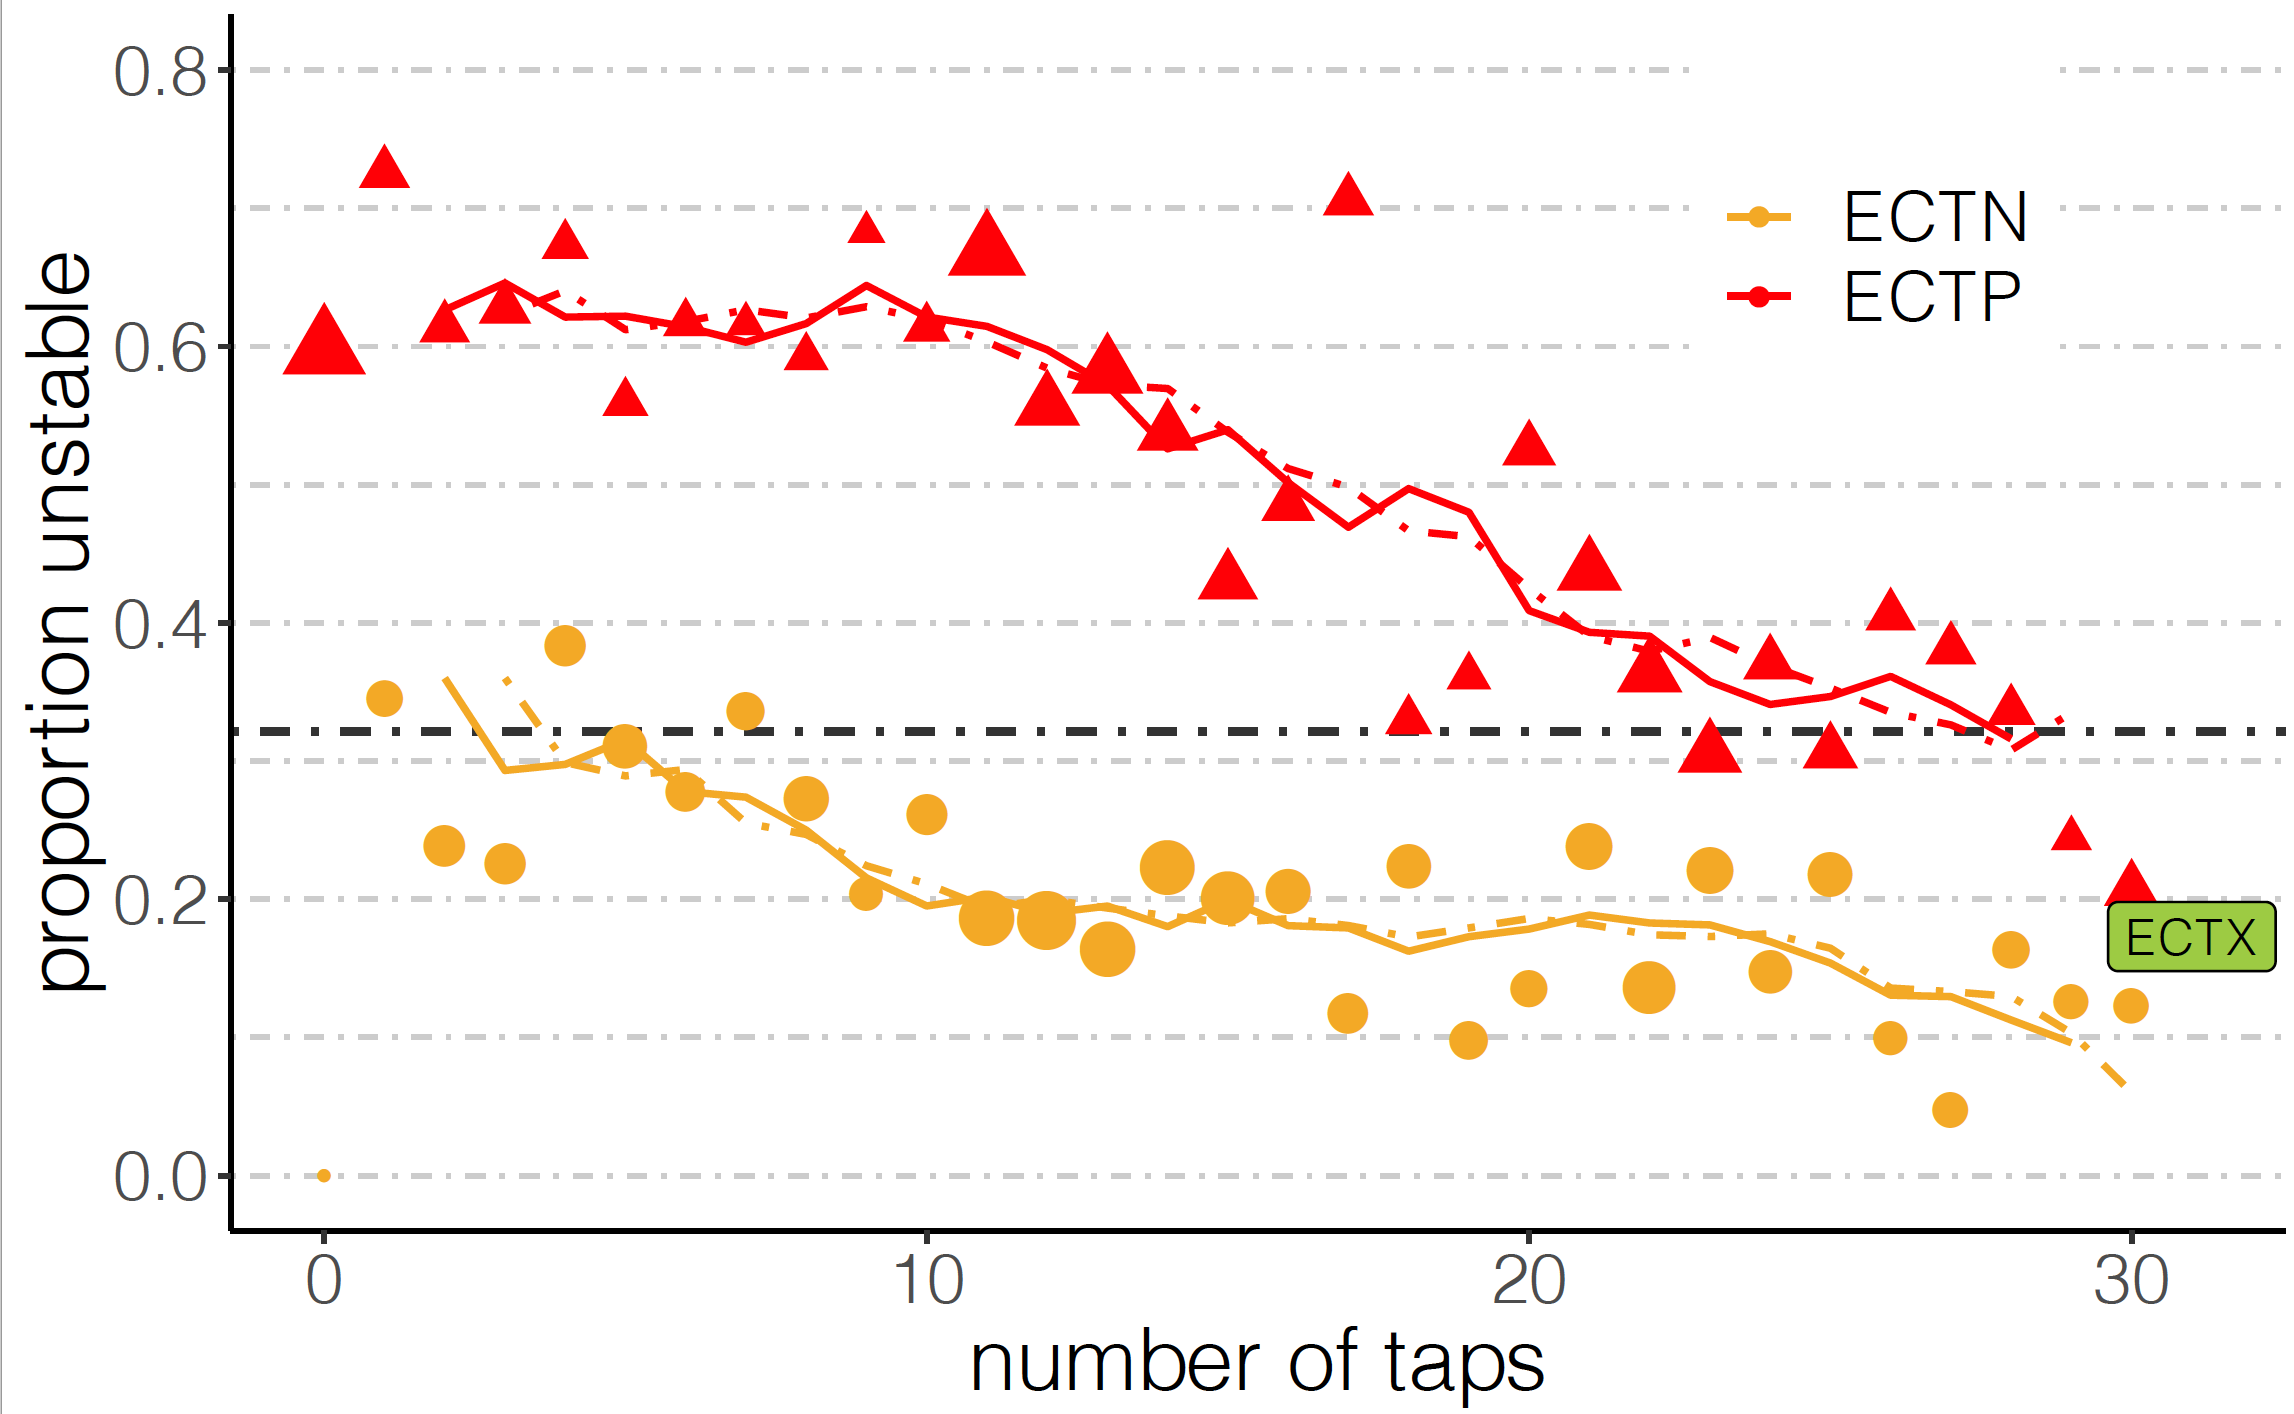
Quite clearly, ECTVs and ECTPs are observed more often on unstable slopes (red line in Figure 1 located above the base rate, represented by the dashed black line), while ECTNs and ECTXs are observed more commonly on stable slopes (yellow line located below the base rate) (Figure 1). Further, ECTs with a higher number of taps tend to be more stable. ECTPs with less than 14 taps were the most unstable, with about 60% of those tests being associated with avalanches or signs of instability. This is about double the number of locations associated with avalanches or signs of instability in our entire dataset (the base rate). While still clearly on the unstable side of the base rate, the proportion of unstable locations decreases with more taps, even with an ECTP result. When more than 22 taps are necessary to initiate a fracture in an ECTP, the proportion of unstable slopes was not significantly higher than the base rate, indicating that such results might be linked to something like “intermediate” stability. We note a similar result for ECTN≤8, while ECTN>8 was clearly linked to stability.
Interpreting the Findings
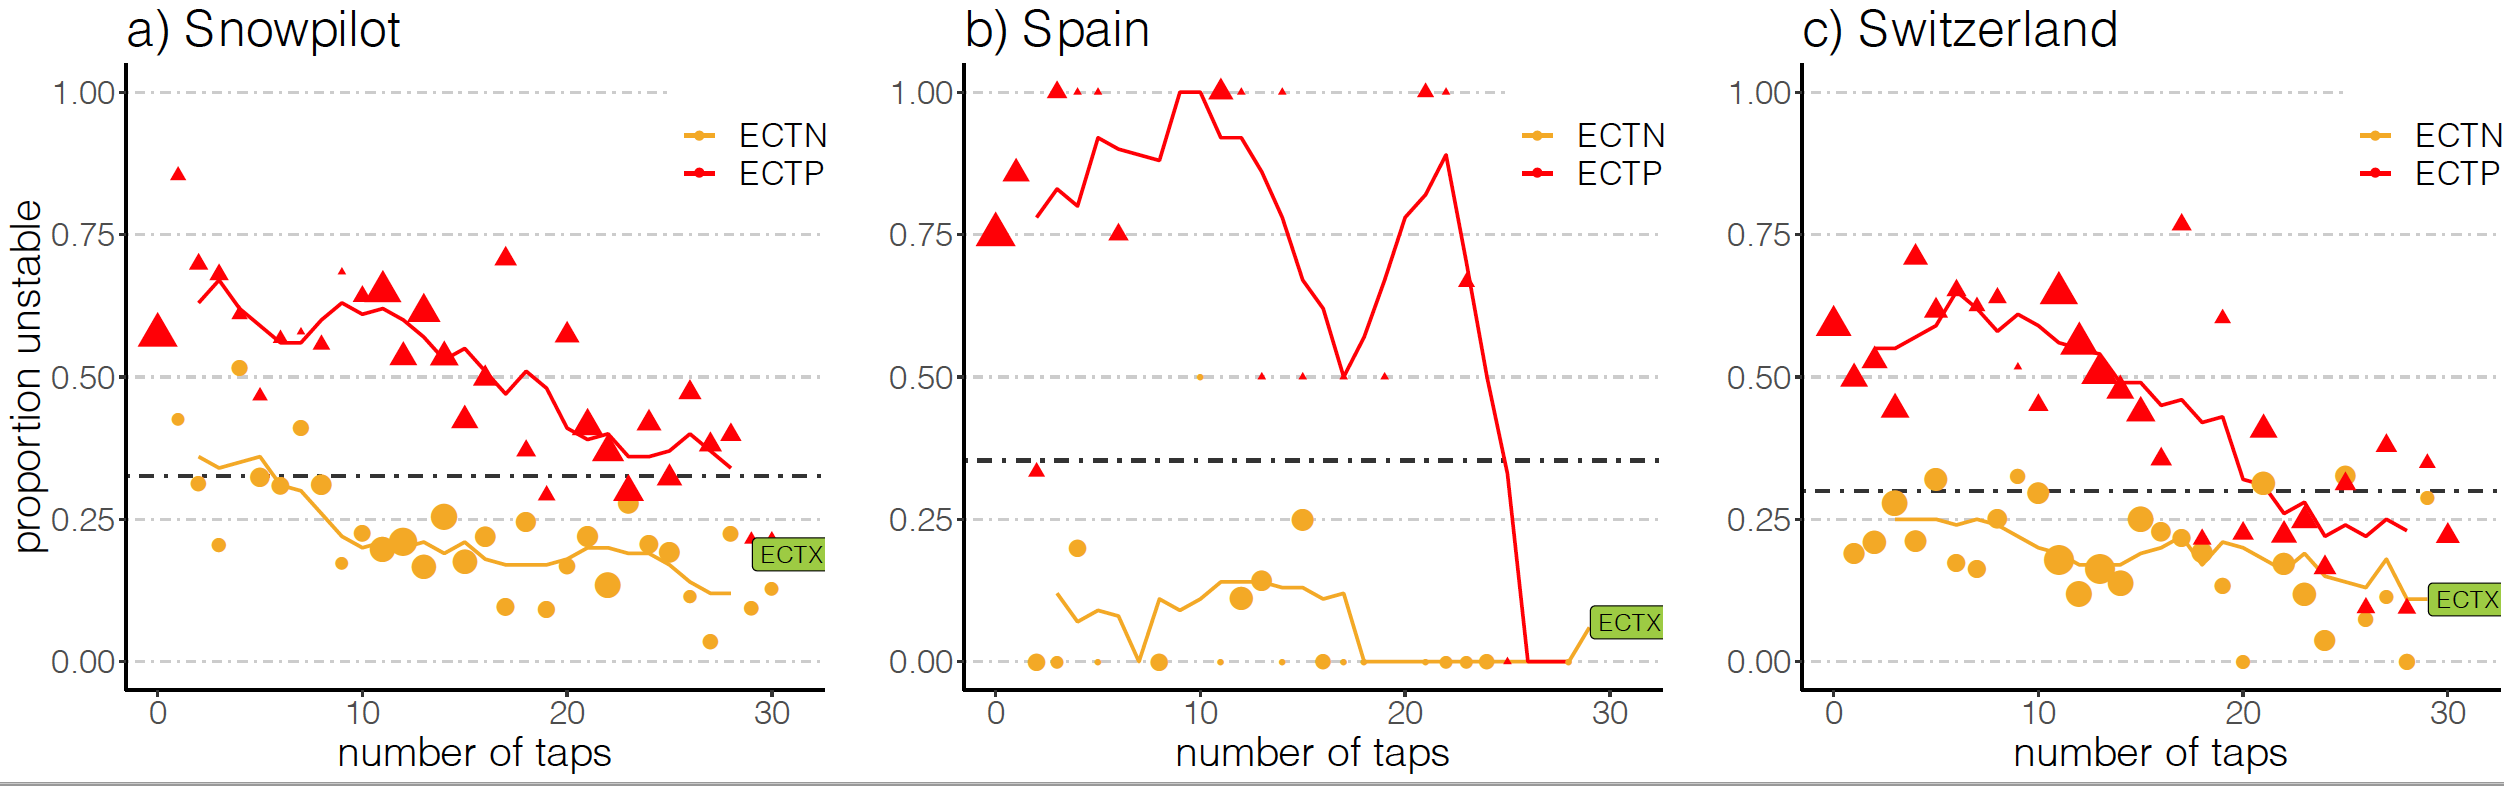
In a perfect world, we would know absolutely whether a slope can be triggered or not. However, in reality, all studies exploring stability tests—including this one—must use other observations to infer slope stability. If the slope stability rating is wrong, which is inevitable for at least part of our data, then the test accuracy drops. For example, in our study we likely had at least some cases where observers did not see any signs of instability but the snowpack was still unstable and avalanches could be triggered. Similarly, there are also likely cases where observers noted signs of instability on nearby slopes, but the slope being tested was in fact stable. These situations lead to a misclassification of the slope stability and have the potential to lower the correct classification by the stability test being evaluated. However, while these cases influence absolute values, it does not influence the observed patterns in Figure 1. We can see this when we compare our much smaller Spanish data set, which was thoroughly quality-checked by the forecasters in Val d’Aran, to our U.S. and Swiss data sets, which both relied on observations submitted together with snow profiles. In Spain, the proportion of unstable locations was about 80% for ECTP≤23, and 8% for ECTN and ECTX in a data set with 35% unstable slopes (Figure 2b). In the U.S. and Switzerland, absolute values and the shape of the curves were remarkably similar (Figures 2a and 2c). The only difference was that the proportion of unstable slopes for ECTP>22 was slightly above the base rate in the U.S. and slightly below in Switzerland.
Take-Home Points
The correlation between signs of instability and ECT scores clearly shows that the ECT is a valuable test for assessing snow instability. Our data confirms the findings in the Swiss study that including the number of taps in addition to the propagation portion of the results can improve the overall accuracy of this test. In line with the work of Techel et al. 2020 on Swiss data, we suggest the following terms for ECT results (see also Figure 3).
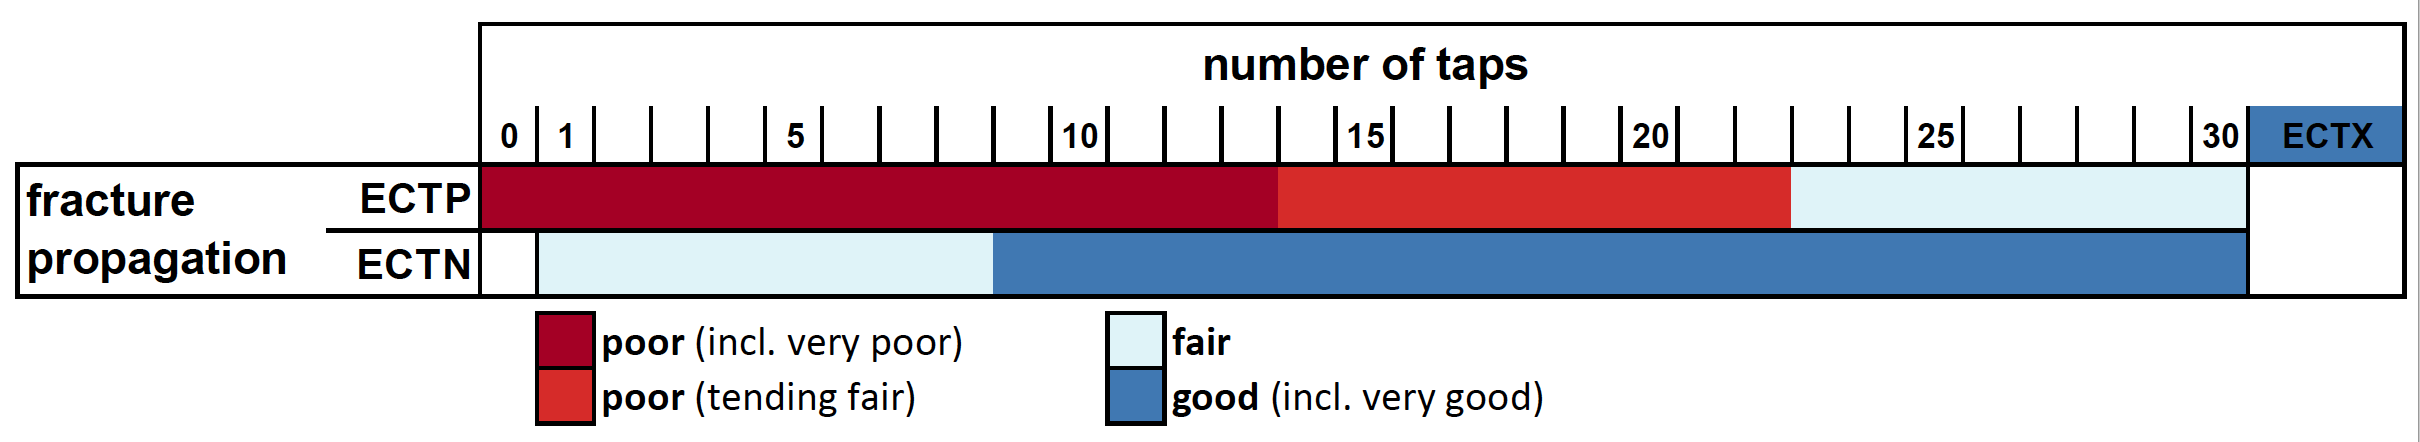
- Poor: ECTPs with easy—and to a lesser extent—moderate scores. In our data, these results are clearly correlated with instability.
- Fair: ECTPs with high scores and ECTNs with low scores. Our results suggest these values are more of a mixed bag in terms of their association with signs of instability.
- Good: ECTNs with moderate and high scores as well as all ECTXs. These results are most often associated with stable conditions.
Even though this classification may help us interpret ECT results, several challenges remain: 1) selecting the right location for the test, 2) determining how representative that location is for the slope(s) of interest, and 3) understanding the inherent spatial variability of test results. Therefore, a single test with stable results should never be used as a sole indicator for stability, but should always be used in combination with many other field observations and additional tests, preferably in different locations. On the other hand, a single test with unstable results is enough to warrant extra caution.
A Side Note: Further Results from a Swiss ECT Study (Techel et al., 2020)
Relying on the Swiss data set, which is included in our analysis, other relevant findings were noted:
- Performing a second ECT in the same snowpit was most useful when the first ECT indicated ECTP>14 or ECTN<10. Particularly in these cases, a second ECT could tip the balance towards indicating instability or stability.
- A direct comparison of ECT results with Rutschblock tests performed in the same snow pit showed that RB test results correlated better with slope stability than ECT results. In other words, if a RB test result indicated instability, more slopes were classified as unstable, compared to an ECT indicating instability. For results indicating stability, the opposite was observed.
References
Greene, E.; Birkeland, K.; Elder, K.; Landry, C.; Lazar, B.; McCammon, I.; Moore, M.; Sharaf, D.; Sterbenz, C.; Tremper, B. & Williams, K., 2010: Snow, weather and avalanches: Observational Guidelines for avalanche programs in the United States. American Avalanche Association, Pagosa Springs, CO.
Simenhois, R., Birkeland, K., 2006: The Extended Column Test: A field test for fracture initiation and propagation, in: Proceedings ISSW 2006. International Snow Science Workshop, Telluride, Co., pp. 79–85
Simenhois, R., Birkeland, K., 2009: The Extended Column Test: Test effectiveness, spatial variability, and comparison with the propagation saw test. Cold Regions Science and Technology 59, 210–216
Techel., F., Winkler, K., Walcher, M., van Herwijnen, A., Schweizer, J., 2020: On the snowpack stability interpretation of Extended Column Test results. Natural Hazards Earth System Sciences
Winkler, K., Schweizer, J., 2009: Comparison of snow stability tests: Extended column test, rutschblock test and compression test. Cold Regions Science and Technology 59, 217–226