This interview with Blase Reardon—TAR editor emeritus and editor of the A3 publication The Snowy Torrents—originally ran on WildSnow on November 12, 2020 and has been reprinted with their permission. You can read the original article here, and check out the rest of the site while you’re at it.
By Manasseh Franklin
On forecast data, the danger scale and public observations
Blase Reardon has been in the avalanche forecasting business for the better part of 20 years. He currently serves as Director of the Flathead Avalanche Center in Montana, where he worked as the lead forecaster prior to that. He has also had forecasting roles with the CAIC in Aspen, the Sawtooth Avalanche Center in Ketchum, and he helped establish Glacier National Park’s Going to the Sun Road avalanche forecasting program.
Often considered a dark art, avalanche forecasting has evolved a great deal over that time. Forecasts were once available via telephone recordings, then emails, and now interactive websites and social media. Forecasts themselves have become more collaborative and comprehensive, and the way forecasters think about what triggers avalanches has shifted. The Conceptual Model of Avalanche Hazard was developed to codify the terms forecasters use and allow for more structured communication across platforms.
As we head into what could be one of the busiest years on record in the backcountry, I called up Blase to talk about the key components and limitations of forecasts, and how new users can get the most out of them.
WS: What are some general things folks should know about avalanche forecasts?
BR: First, understanding what goes into a forecast helps users get more out of a forecast. They can better pick the terrain and practices that match conditions, which leads to better, safer riding.
Second, forecasters write forecasts that they use themselves. We’re not writing conservative forecasts and then doing something different. Sometimes you hear people saying “oh, well they call it Considerable but it’s really not.” No, if we call it considerable, it means considerable. Forecasters write forecasts that we think are useful and accurate. That’s the goal.
Last, a forecast is only as good as the data on which it’s built. Garbage in, garbage out. If you have better, relevant data on conditions, you’re going to get more accurate forecasts with less uncertainty. In places or times that are data sparse, it can be harder to write a forecast. One way to think about that, it’s often easier to write a forecast during a storm period and rising avalanche danger than it is to write a forecast during decreasing avy danger and increasingly static conditions. People aren’t giving you information, and the relevant information is harder to get.
WS: What kinds of data informs avalanche forecasts?
BR: Three components: recent weather data, recent observations, short-term weather forecasts.
The ideal weather data and observations are from all elevations and aspects, but that’s just not really what you get most of the time. There’s a not-so-subtle argument I’m making here to encourage people to provide observations. The more we have to work with, the better forecasts we get.
A lot of the time I haven’t been somewhere, and I have a guess what I think the conditions are there. I’ll get an observation from somebody that confirms what I’m thinking or alerts me that things are not what I’m expecting, and I need to dig into it deeper. Forecasters can’t be everywhere, so public observations are critical for us.
WS: So you have these data sources. What are the next steps in the actual making of the forecast?
BR: There’s a lot of informal communications at first. Discussion among the forecaster team about the observations and people’s expectations, like “that’s a lot more slides than I expected; I dunno about dropping the rating tomorrow” and so on and so forth. But that’s all fairly informal.
In most places, a formal discussion between forecasters happens in the morning long before people wake up. The forecaster may be looking at overnight weather data, and then people are going through other components of the conceptual model for avalanche hazard to identify the type of avalanche problem, how sensitive it is to being triggered, and how widespread it is. Those things give us the likelihood, and the avalanche hazard is a combination of likelihood and potential size.
A forecaster might be like “yeah, I think this layer is reasonably stubborn,” and another forecaster might be like “well, did you hear that observation from so and so that day, and I got this test result, and I think it’s a little more reactive.” So different impressions of the components go into the discussion. Once you have a likelihood and potential size for an avalanche problem, or the multiple problems of the day, you can assign a danger rating to it. Then you have about 45-60 minutes to write the product, if not less.
WS: On the subject of the danger scale, I’m curious about orange and yellow and the fact that more reported incidents occur in that range. Do you think that is working as far as distinctive layers on the danger scale?
BR: That’s a good question. One of the things that some studies are starting to show is that forecasters and the public view the danger scale differently. For forecasters, the scale is an exponential curve. Danger goes up exponentially as the ratings go up. But for a lot of people who aren’t forecasters, it’s a linear thing.
To the public, the difference between moderate and considerable is just one stair-step up, but to a forecaster the difference between moderate and considerable is much sharper because the curve is starting to get really steep.
I’m not entirely sure this is backed up by data but this is an impression, that in the last 20 years we’ve seen far fewer accidents involving people out at high hazard. I think avalanche education and forecasts have done a good job of getting people to find alternate routes or make other plans during high hazard. You could argue that the scale works very well because people are not going into the backcountry when the hazard is widespread.
But you can also view that as more people are out at moderate than at high, and those are conditions where typically the feedback isn’t all that reliable. People can go out at moderate and there’s a persistent slab problem and not get a lot of feedback that it’s dangerous. Whereas, at higher danger levels, other avalanche problems might give a lot of very clear feedback. It’s harder for people to evaluate the conditions at moderate.
Maybe they ski at considerable and nothing happens, just like when they were out at moderate. So maybe they get the idea that moderate and considerable aren’t that different. But that window of conditions is fairly narrow. Whereas, forecasters are often seeing and thinking about a much wider range of conditions.
That’s not necessarily a problem with the danger scale, but more the wicked problem that’s the backcountry, like how do we develop expertise when we get really incomplete and ambiguous feedback.
WS: How would you say that forecasts are limited in what they can offer?
BR: As a forecaster, I have 3-4 sentences. I try to fit in everything I think is important in there. But if you think about the scale of a backcountry forecast zone, that’s always going to involve some sort of generalization and some sort of summary. One problem is that people have to take those four lines and translate it into the terrain that they’re in. Sometimes it’s hard to describe to people what you mean by a mid-slope rollover if they’ve never thought about it. My job is to make that as visceral and easy to understand as I can, but that’s a limitation.
Also, a forecast isn’t slope specific, or even drainage specific so people have to go out and translate that. And their ability to do that depends a lot on how practiced they are. If you think about it, it’s a really complex cognitive task.
Then there’s obviously variability across the zone. Maybe you don’t have really good observations or good weather data because of the amount of new snow varied or a key station is down. A storm brushes one corner of the forecast zone and produces more snow than anticipated, or there’s a weak layer that’s more active in one part of the zone than somewhere else. That kind of variability across the zone is tricky.
WS: What general advice do you have for novice ski tourers who are reading the forecast and trying to get to know how to use the information that it’s giving them?
BR: That’s a timely question because most of us anticipate a surge in backcountry use this year, and a surge of people whose training and experience is just starting. I think the first thing to pay attention to is the danger rating. But there’s a lot of other parts of the forecast.
I generally try to give people a description of terrain that’s ok to play on as well as a description of terrain that’s ‘no way’. Really listening or reading the forecast to get that image ‘ok, I need to be really careful about these kinds of slopes’. Even if that’s early in your training and experience, it can be really useful. There are so many things you’ve got to think about in the backcountry, but if you’re just starting, having one thing to focus on would be great.
People write forecasts so that there’s a lot of education in them. There’s often hyperlinks in the forecast for technical terms. I encourage people to click on those hyperlinks. There are a lot of resources that describe to people how to use a forecast in pretty basic terms, which are great as well. But I think starting with the danger rating, trying to figure out what kind of terrain is ok for play and what kind is no way, and using the stuff that’s on the website to build one’s knowledge over the season is a great approach for people to get started.
WS: Any closing thoughts?
BR: The more observations people provide, even if they’re fairly simple, the easier it is for a forecaster to confirm or start getting curious about something and the higher the quality of forecast is going to be.
So, more data. Send more observations to your local avalanche center.
We’ll add that you should support your local avalanche center, too. Here’s where you can find yours.
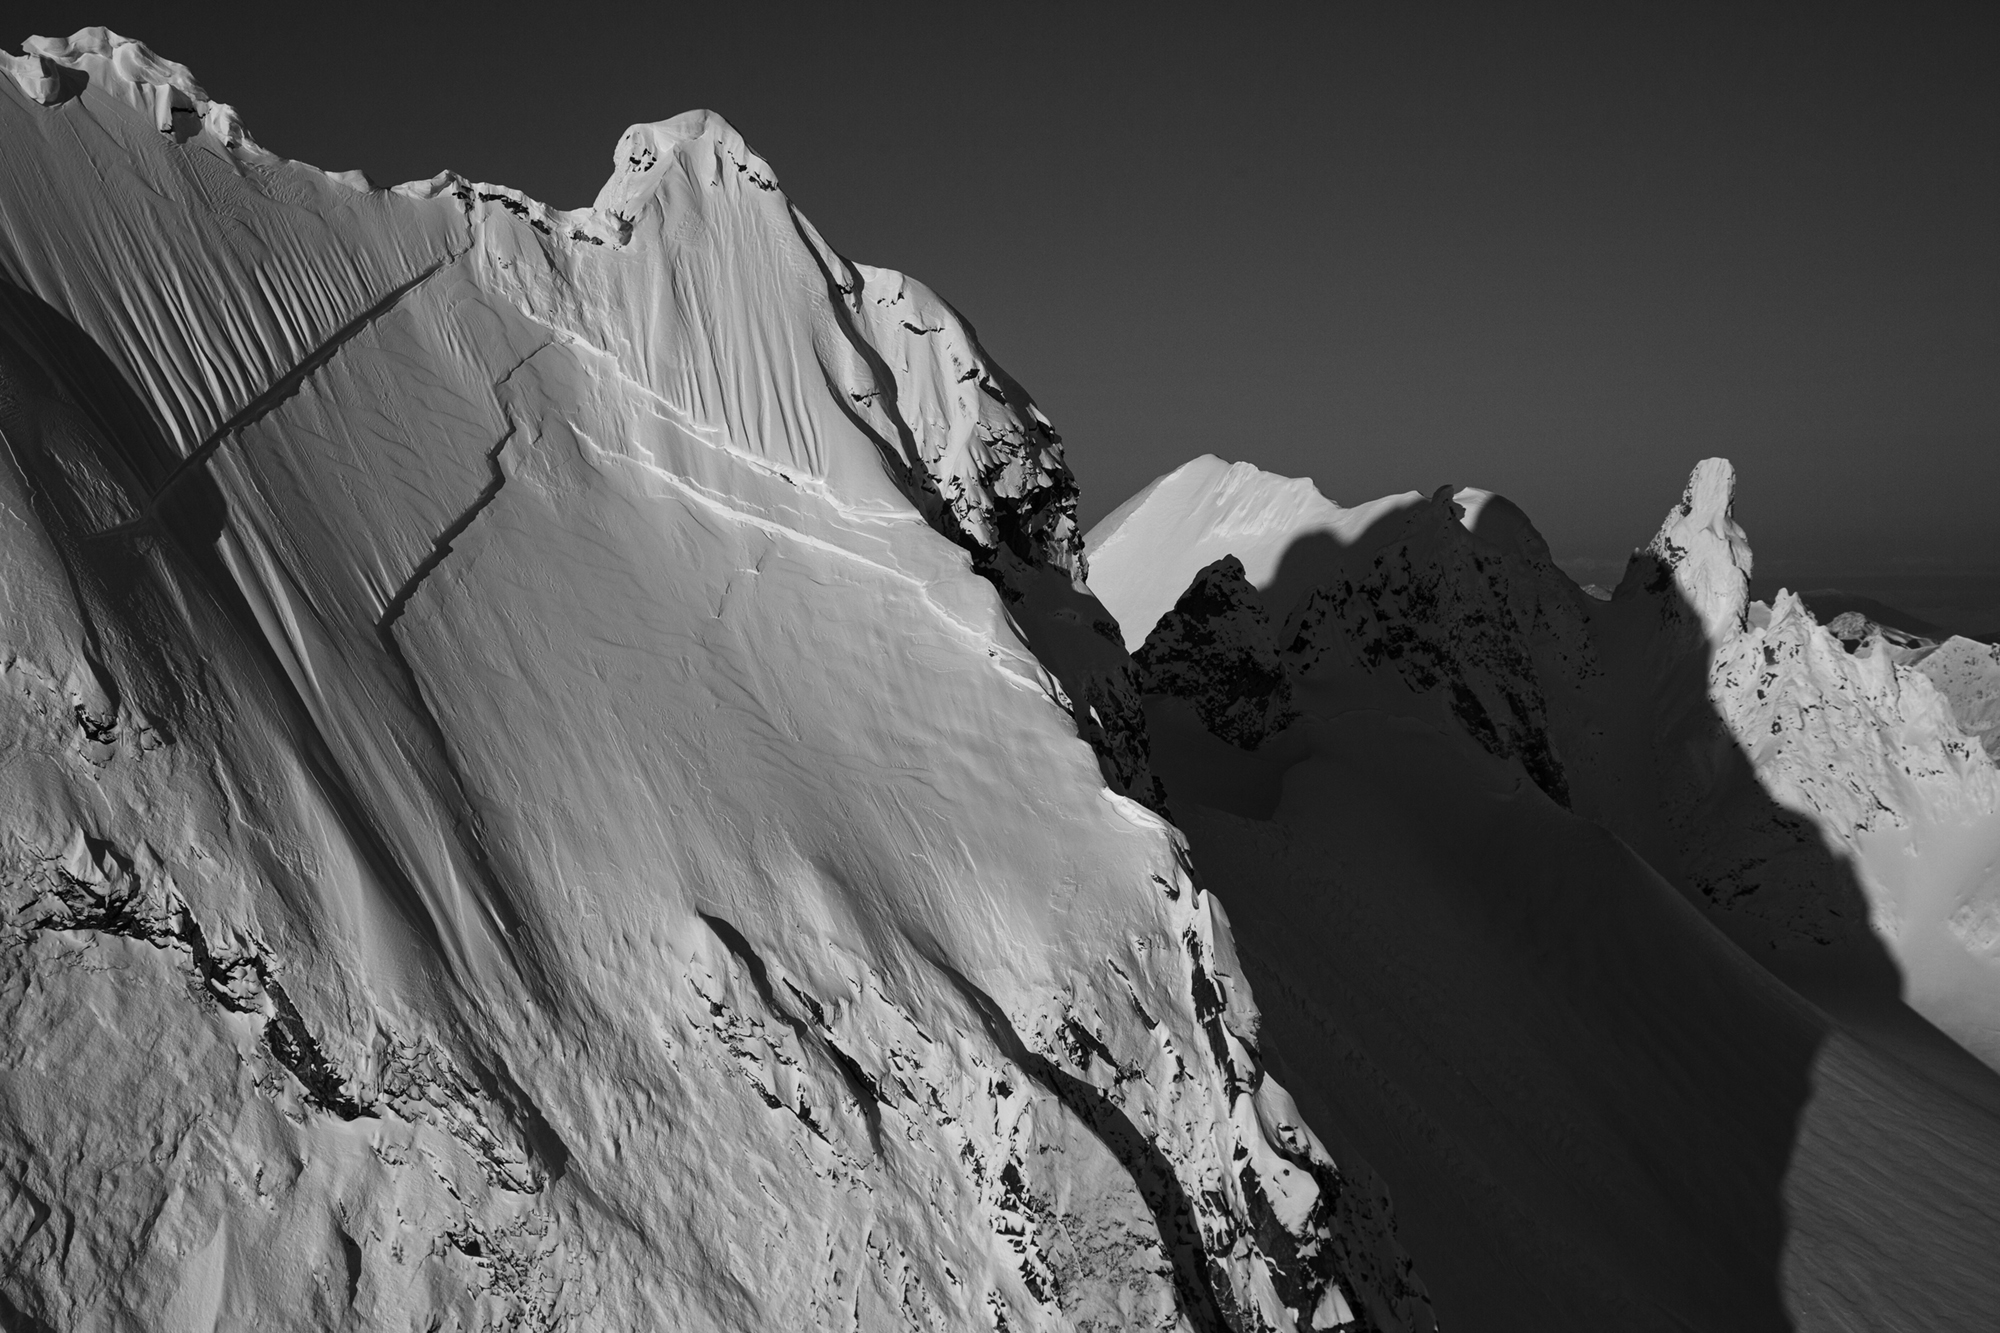
About the featured photo: Avalanche fracture lines on the north face of Mt. Buckindy in the North Cascades of Washington State, April 8, 2011. Photo John Scurlock. This image appeared in TAR 38.3.